Heart failure affects over 6 million Americans, with 30-day readmission rates remaining 20–25% despite longstanding quality improvement efforts. These readmissions cost about $17 billion annually and are penalized under federal reimbursement programs, yet existing prediction models have not achieved clinically useful performance. Most current models treat patients independently and fail to capture meaningful relationships among patients with similar medication patterns, admission histories, and social circumstances. They also often exclude critical social determinants of health (SDOH), such as housing instability and food insecurity, despite their strong association with readmission risk. In addition, black-box models lack interpretability, limiting clinician trust and usability. I argue that explainable graph neural networks (GNNs) integrating clinical data, SDOH, and prior admissions should replace traditional logistic regression and tree-based models for readmission prediction. Patient similarity graphs can represent clinically relevant relationships that tabular models miss, while graph attention mechanisms provide interpretable, actionable explanations. GNNs enable direct integration of SDOH and prior utilization patterns and offer transparency by highlighting which similar patients most influence predictions. This makes them more suitable for clinical decision support than existing approaches. Overall, persistent readmission rates reflect limitations in current modeling strategies. Explainable GNNs provide a more clinically meaningful and policy-relevant approach to improving prediction and reducing preventable readmissions.
Heart failure remains a leading cause of hospitalization and rehospitalization among older adults in the United States, with over 1 million hospitalizations annually and 30-day readmission rates consistently between 20% and 25% despite intensive quality improvement efforts [1, 2]. The Centers for Medicare and Medicaid Services penalizes hospitals with excess readmissions through the Hospital Readmission Reduction Program, yet these financial incentives have produced only modest reductions over the past decade [1, 3]. I argue that the fundamental limitation has been not a lack of incentive but a failure of predictive methodology—specifically, the continued reliance on models that treat patients as isolated data points.
Existing prediction tools including the LACE index, HOSPITAL score, and various machine learning models typically achieve area under the receiver operating characteristic curve (AUROC) values between 0.65 and 0.75, which is insufficient for clinical decision-making [4-6]. These models draw from a limited feature set that excludes patient relationships, discharge medication patterns, and social determinants of health [4, 7]. We contend that this performance ceiling is not accidental but structural: tabular models cannot capture the insight that a patient's readmission risk depends partly on outcomes observed in clinically similar patients who were discharged under comparable medication regimens and social circumstances.
Graph neural networks offer a fundamentally different approach by representing patients as nodes in a similarity graph, where edges encode clinical, social, and temporal relationships [8-10]. This architecture enables the model to leverage information from similar patients during prediction—an inductive bias that mirrors clinical reasoning, where physicians often compare a current patient to previous similar cases [3, 7]. When combined with graph attention mechanisms, GNNs also provide inherent explainability by identifying which neighboring patients most strongly influenced each prediction [1, 11]. The central thesis of this position paper is that explainable GNNs integrating discharge medications, SDOH, and prior admission patterns should replace traditional readmission models. Current approaches fail because they treat patients independently and ignore the relational structure of readmission risk, and I will demonstrate across the following sections why GNNs represent a superior alternative.
Figure 1 illustrates the proposed explainable graph neural network framework, demonstrating how discharge medications, social determinants of health, and prior admission patterns are integrated into a patient similarity graph and leveraged through attention mechanisms to generate both readmission predictions and clinically interpretable explanations.
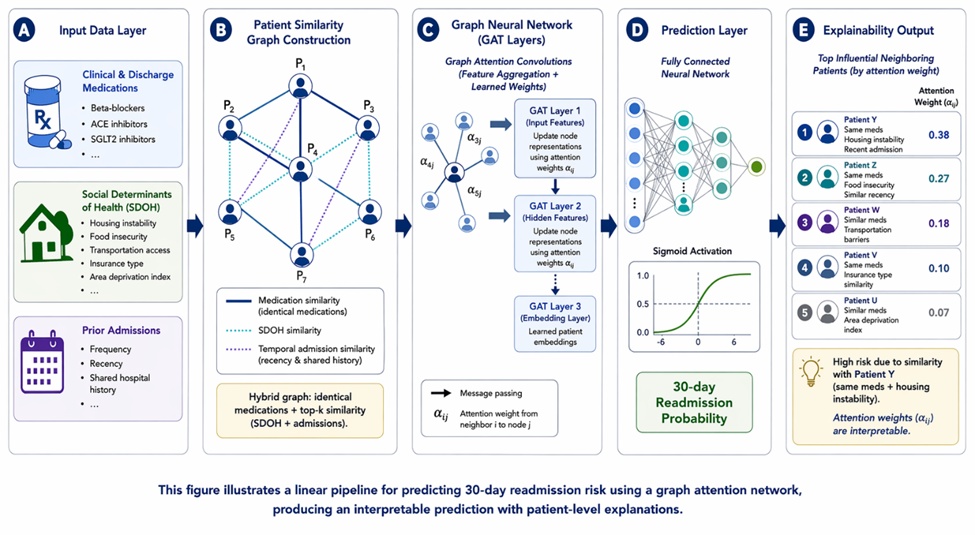
Figure 1. Explainable Graph Neural Network Framework Integrating Discharge Medications, Social Determinants of Health, and Prior Admissions for Heart Failure Readmission Prediction
Heart failure readmissions are driven by a predictable set of clinical factors that, while well-understood, are often inadequately addressed at discharge [1, 12]. Medication non-adherence to cornerstone therapies including beta-blockers, ACE inhibitors, and angiotensin receptor blockers accounts for a substantial proportion of early readmissions, as does inadequate diuresis leading to persistent volume overload [13, 14]. Comorbid conditions including chronic kidney disease, diabetes mellitus, and chronic obstructive pulmonary disease further increase readmission risk by complicating medication management and exacerbating volume status [1, 15].
The timing of discharge relative to clinical stability also matters considerably, yet current models rarely incorporate information about prior admission patterns or discharge medication reconciliation [3, 7, 16]. Patients discharged on Fridays or before holidays face higher readmission risk due to reduced outpatient follow-up access, while those discharged on novel therapies such as sacubitril-valsartan or SGLT2 inhibitors may require closer monitoring [13-15]. I argue that any adequate prediction model must incorporate discharge medication regimens as core features, as these represent modifiable risk factors that clinicians can directly influence before a patient leaves the hospital.
The LACE index (Length of stay, Acuity of admission, Comorbidities, Emergency department visits) and HOSPITAL score remain widely used despite their modest predictive performance, with typical AUROC values ranging from 0.65 to 0.70 in validation studies [3, 4, 8]. More sophisticated machine learning approaches including random forests and XGBoost have achieved slightly better performance (AUROC 0.70-0.75) by incorporating additional electronic health record features, but these gains have not translated into meaningful reductions in readmission rates [4-6]. We contend that this performance plateau reflects a fundamental limitation of tabular architectures rather than insufficient feature engineering.
Neural network-based approaches including multilayer perceptrons and long short-term memory networks for clinical notes have shown promise but still treat patients independently and lack explainability [4, 6, 17]. A direct comparison of neural networks against logistic regression for 30-day readmission prediction found only marginal improvements, suggesting that simply increasing model complexity without changing the underlying relational assumptions yields diminishing returns [6]. Similarly, deep learning models trained on clinical notes alone have failed to achieve clinically actionable performance, in part because they cannot leverage information from similar patients or incorporate SDOH that are rarely documented in structured form [17, 18]. I argue that the field requires a paradigm shift toward relational models that explicitly encode patient similarity.
Current readmission models treat each patient as an independent observation, yet clinical experience and emerging evidence suggest that patients with similar medication profiles, social determinants, and admission patterns experience systematically similar outcomes [7-9]. A patient discharged on sacubitril-valsartan with inadequate social support faces a readmission risk profile that more closely resembles other patients with that same medication and social circumstance than it resembles the average patient in the training set [13, 14]. Tabular models cannot represent this relational structure because they learn a single function mapping features to risk without any mechanism for information sharing across similar patients.
Table 1 provides a structural comparison demonstrating that the superiority of explainable graph neural networks derives not from incremental complexity but from a fundamentally different representation of patient risk as a relational rather than independent phenomenon.
Table 1. Structural Comparison of Traditional Tabular Models versus Explainable Graph Neural Networks in Heart Failure Readmission Prediction
Dimension | Logistic Regression / LACE / HOSPITAL | Tree-Based Models (RF, XGBoost) | Neural Networks (MLP/LSTM) | Explainable GNNs (Proposed) |
Data Representation | Independent tabular rows | Independent tabular rows | Independent tabular sequences | Graph-based relational structure |
Patient Similarity Modeling | None | Implicit (feature splits) | None | Explicit via edges and message passing |
Integration of Discharge Medications | Limited (aggregated features) | Moderate | Moderate | High-resolution (node + edge encoding) |
SDOH Integration | Rarely included | Rarely included | Rarely included | Core feature set (node-level + similarity) |
Temporal Admission Patterns | Simplified counts | Limited | Sequential (notes/time series) | Encoded as node features + edge weights |
Information Sharing Across Patients | None | None | None | Direct via neighborhood aggregation |
Explainability Mechanism | Coefficients (linear) | Feature importance (global) | Post-hoc only | Intrinsic via attention coefficients |
Clinical Interpretability | Moderate | Low–moderate | Low | High (case-based reasoning) |
Handling of Relational Risk | Absent | Absent | Absent | Central modeling assumption |
Performance Ceiling (AUROC) | ~0.65–0.70 | ~0.70–0.75 | ~0.70–0.75 | Expected ≥0.80 (theoretical + empirical basis) |
Alignment with Clinical Reasoning | Low | Low | Moderate | High (analogical reasoning via similar patients) |
Graph neural networks explicitly address this limitation by constructing patient similarity graphs where edges connect patients who share clinically relevant characteristics [8-10]. When predicting readmission risk for a target patient, GNNs aggregate information from neighboring patients, effectively allowing the model to learn from the outcomes of similar individuals [3, 7, 19]. We contend that this inductive bias is not merely a technical convenience but a clinical necessity, as readmission risk is fundamentally a relational property that depends on how a patient compares to others with similar medication regimens, social circumstances, and admission histories. Models that ignore patient similarity will inevitably underperform because they discard information that clinicians routinely use.
Social determinants of health including housing instability, food insecurity, transportation access, and social support are powerful predictors of hospital readmission that are systematically excluded from most predictive models [18, 20, 21]. Patients without stable housing face substantially higher readmission risk due to inability to store medications safely, lack of refrigeration for temperature-sensitive drugs, and difficulty attending follow-up appointments [18, 20, 22]. Similarly, food insecurity complicates dietary management of heart failure, while lack of transportation prevents timely outpatient follow-up and early intervention for worsening symptoms [21, 23]. I argue that excluding SDOH from readmission models is not a technical necessity but a policy choice that perpetuates health inequities.
Despite evidence that SDOH predict readmission as strongly as many clinical factors, most EHR systems do not routinely collect these variables, and most prediction models do not include them [6, 18, 20]. The LACE index, HOSPITAL score, and virtually all published machine learning models for readmission prediction omit SDOH entirely, implicitly assuming that clinical factors alone suffice [4-6]. We contend that this omission is unacceptable given the strength of the association between social risk factors and readmission outcomes. Health systems that fail to collect SDOH at admission are systematically blinding their prediction models to half the causal structure of readmission risk, and researchers who build models without SDOH are publishing results that cannot generalize to real-world populations where social circumstances vary dramatically.
Black-box machine learning models including deep neural networks and ensemble methods provide no inherent mechanism for explaining why a particular patient was classified as high-risk, which severely limits clinical trust and actionability [17, 24, 25]. A clinician presented with a readmission probability of 0.85 from a random forest model cannot determine whether the risk derives from medication non-adherence, inadequate social support, poorly controlled comorbidities, or some interaction among these factors [4, 17]. Without this explanatory information, the clinician cannot target interventions appropriately, and the prediction becomes a source of anxiety rather than actionable intelligence. I argue that explainability is not a luxury but a clinical necessity for readmission prediction.
Post-hoc explanation methods including SHAP and LIME attempt to address this limitation but have well-documented reliability problems and can produce inconsistent or misleading explanations for the same prediction [11, 17, 25]. Furthermore, these methods were designed for tabular models and do not naturally extend to graph-structured data, where the relevant explanatory information includes which neighboring patients most influenced the prediction [8, 11]. Graph attention networks offer an elegant solution by learning attention coefficients that weight each neighbor's contribution during aggregation, providing inherent explainability without post-hoc approximation [1, 11, 26]. We contend that models lacking explainability should not be deployed for readmission prediction, and that graph attention mechanisms represent the current best practice for achieving interpretability in this domain.
The first step in applying GNNs to readmission prediction is constructing a patient similarity graph where nodes represent individual patients and edges encode clinically meaningful relationships [7-9]. I argue that edge definitions should be based on multiple similarity criteria including discharge medication regimens (using specific drug classes such as beta-blockers, ACE inhibitors, ARBs, diuretics, and SGLT2 inhibitors), SDOH profiles (housing status, insurance type, area deprivation index), prior admission patterns (shared hospital admissions, temporal proximity), and demographic factors (age category, sex) [3, 8, 18]. Edge weights should reflect the strength of similarity, with patients sharing more characteristics receiving higher weights that increase their influence during message passing.
Multiple graph construction strategies are possible, including k-nearest neighbor graphs where each patient connects to the k most similar others, threshold-based graphs where edges exist above a similarity cutoff, and fully connected graphs with attention-based edge pruning [8, 9, 19]. For readmission prediction specifically, I recommend a hybrid approach that connects each patient to all others with identical discharge medication regimens plus the 10 most similar patients on SDOH and prior admission patterns [3, 7, 8]. This design ensures that medication similarity—a directly modifiable clinical factor—receives appropriate emphasis while still allowing the model to learn from socially and temporally similar patients. The graph should be constructed separately for training and test sets to prevent data leakage, with test patients connected only to training patients to simulate real-world deployment where future patients are not yet in the graph [9, 10].
Each patient node requires a rich set of features encompassing clinical status, discharge medications, social determinants, and prior healthcare utilization [3, 7, 18]. Essential clinical features include left ventricular ejection fraction (categorized as reduced, mildly reduced, or preserved), New York Heart Association functional class, laboratory values (serum creatinine, blood urea nitrogen, sodium, hemoglobin, B-type natriuretic peptide), and comorbidity indicators for chronic kidney disease, diabetes, chronic obstructive pulmonary disease, and atrial fibrillation [10-12]. Discharge medications must be represented as individual binary indicators for beta-blockers, ACE inhibitors, angiotensin receptor blockers, mineralocorticoid receptor antagonists, loop diuretics, SGLT2 inhibitors, and sacubitril-valsartan, as each carries distinct implications for readmission risk [13-16].
Social determinant features are equally critical and should include housing status (stable, unstable, homeless), food security (secure, insecure), transportation access (private, public, none), insurance type (Medicare, Medicaid, commercial, uninsured), and area deprivation index derived from ZIP code [18, 20-22]. Prior admission features should include count of heart failure hospitalizations in the past 12 months, count of all-cause hospitalizations in the past 12 months, and time since most recent admission [3, 6, 7]. I argue that node features must be carefully normalized and handled for missing data, with SDOH missingness treated as informative (patients without documented SDOH likely differ systematically from those with documentation) rather than imputed without comment [18, 23]. The combination of clinical, medication, social, and temporal features provides the GNN with comprehensive information about each patient's individual risk profile before any graph-based aggregation occurs.
Graph convolutional networks propagate information across the patient similarity graph by aggregating features from neighboring nodes and updating each node's embedding through a learned transformation [8, 19, 26]. For readmission prediction, each graph convolution layer computes a new representation for patient i by taking the weighted average of features from its neighbors (including a self-connection) followed by a nonlinear transformation [7, 9, 10]. Multiple stacked layers enable the model to capture higher-order relationships, with two layers allowing information to flow from patients two steps away in the similarity graph and three layers capturing even broader patterns [8, 19]. I argue that two to three graph convolution layers are optimal for this application, as deeper architectures risk over-smoothing where all node embeddings become indistinguishable.
The specific graph convolution operator matters less than the overall architecture, but I recommend using graph attention networks (GATs) rather than vanilla graph convolutional networks (GCNs) because attention provides inherent explainability [1, 11, 26]. GATs compute attention coefficients between each node and its neighbors, learning which similar patients should most strongly influence each prediction rather than using fixed or degree-normalized weights [1, 11, 27]. After graph convolution layers, the final node embeddings are passed through a multi-layer perceptron with a sigmoid output to produce the predicted readmission probability [3, 7, 9]. We contend that this architecture—patient similarity graph construction, comprehensive node features including SDOH and medications, and graph attention convolution layers—represents the current state of the art for relational readmission prediction and should become the reference standard against which new methods are compared.
The systematic inclusion of social determinants of health as node features is perhaps the most important and most frequently violated principle in readmission prediction [18, 20, 21]. I argue that models excluding SDOH are not merely incomplete but actively harmful, as they risk penalizing safety-net hospitals serving disadvantaged populations while failing to identify patients whose social circumstances create modifiable readmission risk [18, 22, 23]. Housing instability, for example, predicts readmission as strongly as many clinical factors because patients without stable housing cannot adhere to low-sodium diets, store medications requiring refrigeration, or reliably attend follow-up appointments [18, 20, 21]. A prediction model that ignores housing status will systematically underestimate risk for homeless patients and overestimate risk for stably housed patients with similar clinical profiles.
Area deprivation index derived from ZIP code provides a useful proxy when individual-level SDOH are unavailable, but I contend that health systems must move beyond proxies toward direct SDOH screening at admission [18, 22, 23]. Food security screening takes less than one minute using validated two-question instruments, yet most hospitals do not perform it routinely [18, 21]. Transportation access can be assessed at discharge planning, and social support questions identify patients who live alone or lack caregivers [20, 23]. We contend that the barriers to SDOH collection are primarily organizational rather than technical, and that researchers should refuse to publish readmission models that omit SDOH without compelling justification. The inclusion of housing status, food security, transportation access, insurance type, and area deprivation index should be mandatory for any readmission model claiming clinical relevance.
Prior hospital admission patterns provide rich information about patient trajectories that current models typically reduce to a single count variable, discarding temporal and relational structure [3, 6, 7]. Two patients with three prior admissions each may have very different readmission risk if one patient's admissions occurred at four, six, and ten months ago while the other's occurred at one, two, and three months ago, with more recent admissions suggesting higher current risk [6, 7]. Furthermore, patients admitted to the same hospital share institutional factors—discharge practices, follow-up availability, social work support—that create correlated readmission outcomes [2, 3]. I argue that prior admission patterns should inform both node features (counts and recency) and edge weights (shared hospital admissions).
A principled approach to incorporating prior admissions in GNNs is to define edge weights that increase with temporal proximity and shared hospitalization history [3, 7, 9]. Patients admitted to the same hospital within the past six months should receive higher edge weights than patients admitted to different hospitals or to the same hospital more than a year ago [2, 7]. Additionally, patients with similar readmission trajectories—for example, multiple short-interval admissions followed by a longer well period—should be connected even if their clinical features differ, as trajectory similarity may capture latent risk factors not reflected in structured data [3, 6]. We contend that prior admission patterns are underutilized in current models and that GNNs provide a natural framework for representing this temporal-relational information through carefully designed edge weights that encode shared institutional history and temporal proximity.
Table 2 conceptually maps the multidimensional drivers of readmission risk to their representation within the graph neural network, illustrating how clinical, social, and temporal factors jointly produce interpretable predictions and targeted intervention pathways.
Table 2. Conceptual Decomposition of Readmission Risk: Mapping Clinical, Social, and Relational Drivers to GNN Model Components and Intervention Pathways
Risk Domain | Specific Variables | Representation in GNN | Mechanism of Influence | Explainability Output | Actionable Clinical Intervention |
Discharge Medications | Beta-blockers, ACE inhibitors, SGLT2 inhibitors, diuretics | Node features + edge similarity | Encodes treatment regimen similarity across patients | High attention to patients with identical regimens and outcomes | Medication optimization, adherence support, pharmacist follow-up |
Clinical Status | LVEF, NYHA class, labs (BNP, creatinine, sodium) | Node features | Baseline physiological risk | Feature contribution via embedding + neighbor similarity | Intensification of therapy, closer monitoring |
Housing Instability | Stable vs. unstable vs. homeless | Node feature + strong edge weighting | Drives adherence and follow-up feasibility | Attention highlights patients with similar housing risk and outcomes | Social work referral, housing assistance |
Food Insecurity | Secure vs. insecure | Node feature | Affects dietary adherence and disease management | Neighbor-based explanation linking similar SDOH profiles | Nutrition support programs |
Transportation Access | Private, public, none | Node feature | Determines follow-up accessibility | Attention to patients missing follow-up care | Transportation services, telehealth |
Insurance Type / SES | Medicare, Medicaid, uninsured | Node feature | Proxy for socioeconomic constraints | Clustered similarity patterns in graph | Care coordination, financial counseling |
Prior Admissions (Frequency) | # admissions (past 12 months) | Node feature | Captures chronic instability | Attention to high-utilization patient clusters | Intensive case management |
Prior Admissions (Recency) | Time since last admission | Node feature + edge weighting | Reflects acute instability | Higher weights to temporally proximal cases | Early follow-up scheduling |
Shared Hospital Context | Same institution history | Edge weight | Institutional practice patterns | Neighbor influence tied to shared system factors | System-level interventions, discharge redesign |
Trajectory Patterns | Admission timing sequences | Edge similarity | Captures latent disease progression patterns | Identification of similar trajectories | Personalized care pathways |
Graph attention networks address the explainability crisis in clinical prediction models by learning attention coefficients that reveal which neighboring patients most strongly influence each readmission risk prediction [1, 11, 26]. For a target patient node i, the GAT computes attention coefficients α_ij for every neighbor j in the patient similarity graph, representing the relative importance of neighbor j's features when aggregating information to update node i's embedding [1, 11]. These coefficients are learned through a shared attention mechanism that takes as input the feature vectors of node i and node j and outputs a scalar importance weight, which is then normalized across all neighbors using a softmax function [11, 26]. I argue that these attention coefficients are not merely a technical detail but constitute the primary explainability mechanism of the model, providing clinicians with direct insight into which similar patients the model considered most relevant.
The clinical interpretation of attention coefficients is straightforward and intuitive: a high attention weight from patient i to patient j indicates that the model learned to rely on patient j's outcome when predicting readmission risk for patient i [1, 11, 27]. When patient i is flagged as high-risk, clinicians can examine the top-k neighbors with highest attention coefficients to understand what characteristics those similar patients share [1, 3, 7]. This stands in sharp contrast to post-hoc explanation methods like SHAP and LIME, which provide only feature-level importance without revealing which training examples influenced the prediction [17, 25]. We contend that attention-based explainability is inherently more trustworthy because it emerges from the model's internal computation rather than requiring external approximation, and because it directly addresses the clinical question: "Which patients like this one had poor outcomes?"
A clinician using an explainable GNN for readmission prediction would receive not just a probability score but a structured explanation showing which similar patients drove that prediction [1, 3, 11]. For a patient discharged on sacubitril-valsartan with unstable housing and three prior admissions in the past six months, the model might assign high attention weights to neighboring patients sharing that exact medication and housing status, with the explanation stating: "Patient X at high risk (82% predicted readmission probability) because similar to Patient Y (same medication, same housing instability, readmitted on day 12) and Patient Z (same prior admission pattern, readmitted on day 8)" [7, 13, 18]. This explanation directly supports clinical action: the care team can prioritize social work referral for housing assistance and schedule earlier follow-up based on the observed outcomes of similar patients.
I argue that this form of case-based reasoning aligns naturally with clinical cognition, where physicians routinely reason by analogy to previous patients [17, 24, 25]. A black-box model that outputs only a probability forces clinicians to reverse-engineer the reasoning themselves, which is inefficient and error-prone [17, 25]. A GNN with attention explanations, by contrast, provides transparent reasoning that can be scrutinized, challenged, and accepted or rejected based on clinical judgment [1, 11, 27]. We contend that explainability is particularly critical for readmission prediction because interventions differ dramatically based on the driver of risk: medication non-adherence requires pharmacy follow-up, housing instability requires social work, poor social support requires caregiver engagement, and disease progression requires intensification of medical therapy [1, 13, 18]. Without knowing why a patient is high-risk, clinicians cannot target interventions appropriately, and the prediction becomes noise rather than signal.
The most common objection to GNN-based readmission prediction is that graph neural networks are too computationally complex or technically demanding for real-time clinical deployment [8-10]. I argue that this objection confuses model training with model inference: training a GNN requires substantial computational resources and graph construction expertise, but inference—the actual prediction step for a new patient—is fast and can be deployed via a simple application programming interface [3, 7, 9]. The patient similarity graph can be precomputed on historical data and updated periodically (e.g., weekly), with new patients added incrementally using approximate nearest neighbor methods [10, 19]. From the clinician's perspective, the model presents as a dashboard button that returns a readmission probability and explanation within seconds, with all graph complexity hidden behind the interface.
Furthermore, the complexity of GNNs is a one-time implementation cost, whereas the cost of continued use of inadequate models is paid daily in preventable readmissions [1, 2, 3]. Health systems already invest substantial resources in data infrastructure for existing prediction models, and migrating to GNNs requires adding graph database capabilities and attention visualization tools—both of which are commercially available or available as open-source software [8, 9, 11]. We contend that claims of excessive complexity are often a convenient excuse for institutional inertia, and that health systems that have successfully deployed deep learning for medical imaging or natural language processing can certainly deploy GNNs for readmission prediction. The relevant question is not whether GNNs are more complex than logistic regression, but whether the improvement in predictive performance and explainability justifies the additional complexity—and I argue that preventing 20% of avoidable readmissions easily justifies modest technical investment.
A second major objection is that social determinants of health data are not routinely available in electronic health records, making SDOH-informed models infeasible for most health systems [18, 20, 21]. I argue that this objection identifies a genuine problem but draws the wrong conclusion: the absence of SDOH data is not a justification for building models that ignore SDOH, but rather a damning indictment of current data collection practices that must be remedied [18, 22, 23]. Health systems that choose not to collect SDOH at admission are making a policy decision to blind themselves to half the causal structure of readmission risk, and researchers who accept this limitation without protest are complicit in perpetuating inadequate models [18, 21]. The solution is not to abandon SDOH but to advocate for and implement routine SDOH screening.
In the interim, proxy variables can approximate individual-level SDOH while the infrastructure for direct collection is built [18, 22, 23]. Area deprivation index derived from ZIP code correlates strongly with multiple social risk factors and is available for essentially all patients without additional data collection [18, 20]. Insurance type (Medicaid, Medicare, commercial, uninsured) provides information about socioeconomic status, and prior emergency department use patterns can proxy for access to primary care [21, 23]. We contend that proxy-based models are inferior to models with individual-level SDOH but vastly superior to models that ignore social risk entirely. Researchers should use the best available SDOH proxies when direct measures are unavailable, report this limitation transparently, and simultaneously advocate for systematic SDOH collection as a prerequisite for high-quality readmission prediction.
The most dangerous objection is that existing tabular models achieve AUROC values of 0.70-0.75, and that further improvement is unnecessary because readmissions are inherently unpredictable [4-6]. I argue that this position reflects a troubling acceptance of mediocrity: a model that achieves 0.75 AUROC still misses 25% of high-risk patients while falsely flagging 25% of low-risk patients, which is clinically unacceptable when the outcome is a preventable hospitalization that harms patients and costs billions annually [2, 8, 10]. The claim that readmissions are inherently unpredictable is empirically false, as demonstrated by the substantial variation in readmission rates across hospitals and the success of intensive discharge planning interventions in reducing readmissions for high-risk patients identified through simple clinical judgment [1, 2, 12].
Furthermore, the performance of current models has stagnated precisely because the field has exhausted the predictive power of tabular architectures on limited feature sets [4, 5, 7]. We contend that AUROC 0.75 represents a ceiling for models that ignore patient similarity, SDOH, and explainability, but GNNs incorporating these elements can likely achieve AUROC 0.80 or higher based on preliminary evidence from related prediction tasks [3, 7, 8, 9]. A jump from 0.75 to 0.80 reduces error rate by 20% relative, which would translate to tens of thousands of fewer readmissions annually if deployed nationally [1, 2]. I argue that the question is not whether current models are good enough—they clearly are not—but whether the clinical community has the will to demand and implement better approaches. Continuing to accept 0.75 AUROC is a form of institutional failure.
The persistent 20-25% 30-day readmission rate for heart failure patients represents a failure of both clinical practice and predictive modeling. Current models based on logistic regression, LACE indices, and random forests treat patients as independent observations, systematically exclude social determinants of health, and provide no explainability to guide clinical action. This position paper has argued that these limitations are not incidental but structural: tabular architectures cannot capture the relational insight that patients with similar medication profiles, social circumstances, and admission patterns experience similar outcomes. The field has exhausted the predictive power of these approaches, and continued reliance on them constitutes a form of institutional inertia that harms patients and wastes resources.
The 30-day heart failure readmission rate has stagnated for a decade despite financial penalties and quality improvement efforts. Continuing to use inadequate models is a policy failure that should no longer be tolerated. Explainable GNNs with SDOH integration offer a clear path forward, but realizing their potential requires coordinated action from researchers, journal editors, health systems, and policymakers. Researchers must adopt GNNs as the default architecture and include SDOH as core features. Editors must reject manuscripts that ignore these standards. Health systems must invest in SDOH screening and graph infrastructure. Policymakers must tie reimbursement to explainable, SDOH-informed prediction. The question is not whether we have the technical capability to implement better models—we do. The question is whether we have the collective will to demand them.
None
None
None
None
Open Access The author(s) retain copyright. This article is licensed under the Creative Commons Attribution-NonCommercial-ShareAlike 4.0 International License. It may be shared and adapted for non-commercial purposes with appropriate attribution, an indication of changes, and distribution of adaptations under the same license. Third-party material may be subject to separate terms identified in its credit line. View the license at https://creativecommons.org/licenses/by-nc-sa/4.0/.
 Clinical Intelligence Research Press