Neovascular age-related macular degeneration (wet AMD) is the most severe form of AMD, driven by choroidal neovascularization that can cause rapid, irreversible central vision loss. Early anti-VEGF treatment preserves vision, making timely identification of progression from intermediate AMD critically important. However, current surveillance methods are insufficient for accurately predicting which patients will convert to neovascular disease. Existing prediction models rely mainly on a single imaging modality such as fundus photography or optical coherence tomography (OCT), limiting their ability to capture the full spectrum of disease features. Important clinical factors—age, genetics, and lifestyle—are also often underused. This lack of integrated multimodal modeling limits accurate risk stratification. We propose a multimodal transformer framework that integrates fundus images, OCT volumes, and clinical variables to predict progression from intermediate to neovascular AMD. Modality-specific encoders convert each data type into unified token representations, which are then fused using a cross-modal transformer to generate a calibrated progression risk score. The system includes a vision transformer-based fundus encoder, a 3D OCT volume encoder, a clinical variable MLP encoder, a cross-modal attention module for information fusion, and a classifier that outputs time-to-neovascular conversion risk. The framework learns shared representations across modalities, enabling interaction between imaging biomarkers and clinical risk factors. Cross-modal attention helps uncover complex patterns that may precede neovascularization and are not visible in single-modality models. This framework enables integrated, multimodal risk prediction for AMD progression, offering a foundation for personalized monitoring and earlier intervention through improved risk stratification.
Age-related macular degeneration constitutes the leading cause of irreversible blindness among adults over 65 years of age in developed countries, with neovascular AMD accounting for the disproportionate majority of severe vision loss despite representing only a minority of late-stage cases [1]. The neovascular form is pathologically defined by choroidal neovascularization, wherein abnormal blood vessels originating from the choroid breach Bruch's membrane and extend into the subretinal or intraretinal space, causing exudation, hemorrhage, and fibrovascular scarring that rapidly destroys central photoreceptors [2]. Anti-vascular endothelial growth factor therapy, administered through intravitreal injection, has transformed the prognosis of neovascular AMD by suppressing pathological angiogenesis and restoring retinal architecture when treatment is commenced before irreversible structural damage occurs [3].
Intermediate AMD, characterized clinically by the presence of large drusen exceeding 125 microns in diameter and retinal pigment epithelium abnormalities, carries a substantial risk of progression to advanced disease, with epidemiological studies demonstrating that approximately 10 to 20 percent of affected eyes convert to neovascular AMD within a five-year follow-up window [4]. Current clinical monitoring protocols typically schedule follow-up examinations at intervals of six to twelve months, a strategy that relies on patient self-reporting of visual symptoms and may delay detection of asymptomatic neovascular conversion events that occur between scheduled visits [5]. The development of sensitive and specific prediction tools that can stratify intermediate AMD patients by their individualized risk of progression represents a critical unmet need in retinal care, as high-risk individuals could be offered intensified surveillance or prophylactic intervention [6].
Retinal imaging modalities provide complementary perspectives on AMD pathology, with fundus photography offering en face visualization of drusen size, confluence, and spatial distribution across the posterior pole, while optical coherence tomography generates high-resolution cross-sectional images that reveal drusen volume, hyperreflective foci, subretinal drusenoid deposits, and early exudative signs including intraretinal fluid [7]. Clinical variables encompassing demographic factors, genetic susceptibility loci such as complement factor H and age-related maculopathy susceptibility 2 polymorphisms, smoking history, and dietary patterns contribute orthogonal prognostic information that is not directly observable through imaging alone [8]. The challenge lies in integrating these heterogeneous data sources, which differ fundamentally in dimensionality, spatial resolution, and information content, into a unified predictive model that leverages their collective strengths [9].
The clinical classification of age-related macular degeneration follows a severity spectrum established through longitudinal natural history studies, with early AMD defined by the presence of small drusen measuring less than 63 microns in diameter, intermediate AMD characterized by medium to large drusen exceeding 125 microns or retinal pigment epithelium abnormalities including hyperpigmentation and hypopigmentation, and late AMD manifesting as either neovascular disease or geographic atrophy [10]. The rate of progression from intermediate to advanced AMD varies substantially across individuals, with genetic predisposition, environmental exposures, and baseline morphological features all contributing to differential trajectories of disease evolution [11]. Understanding the temporal dynamics of AMD progression is essential for designing prediction models that can identify therapeutic windows during which intervention may alter the natural history of the disease, particularly for the neovascular form where the onset of choroidal neovascularization can occur precipitously [12].
Retinal imaging technologies have become indispensable tools for AMD diagnosis, staging, and monitoring, with fundus photography enabling the documentation and quantification of drusen number, size, and morphological characteristics across the macular region, while also capturing pigmentary abnormalities and geographic atrophy boundaries when present [13]. Optical coherence tomography provides cross-sectional visualization of retinal layers with micron-scale axial resolution, revealing drusen volumetric properties, retinal pigment epithelium elevation and detachment, hyperreflective foci as potential precursors to neovascular activity, and early exudative features including subretinal and intraretinal fluid accumulation [14]. The complementary nature of these imaging modalities suggests that their joint analysis could uncover structural biomarkers of impending neovascular conversion that remain occult when either modality is interpreted in isolation, as fundus photography captures the spatial extent of drusen burden while optical coherence tomography delineates the vertical dimension and internal reflectivity characteristics of these deposits [15].
Beyond imaging-derived biomarkers, a constellation of clinical risk factors contributes independently to AMD progression risk, with advancing age representing the single strongest predictor of conversion to late-stage disease across all populations studied [16]. Genetic variants in the complement pathway, most notably the complement factor H Y402H polymorphism and the age-related maculopathy susceptibility 2 A69S variant, confer substantial attributable risk for AMD development and progression, with homozygosity for risk alleles associated with markedly elevated conversion rates [17]. Modifiable risk factors including tobacco smoking, dietary antioxidant intake, and cardiovascular comorbidities further modulate progression probability, as demonstrated by the Age-Related Eye Disease Study risk assessment model that integrates demographic, behavioral, and clinical variables into a composite risk score [18]. The AREDS simplified severity scale provides a clinically accessible tool for estimating progression risk based on drusen size and pigmentary abnormality presence in each eye, yet this scale does not incorporate the granular information available through optical coherence tomography or genetic testing, leaving substantial predictive capacity unrealized [19].
The transformer architecture, originally developed for natural language processing tasks, has been successfully adapted to computer vision through the vision transformer framework, which treats images as sequences of non-overlapping patches embedded into a high-dimensional token space and processed through self-attention mechanisms that capture long-range dependencies across the visual field [20]. Extensions of this paradigm to three-dimensional medical imaging data have demonstrated the capacity of volumetric vision transformers to learn spatiotemporally coherent representations from sequential slices, with architectures such as UNETR and Swin UNETR achieving competitive performance on brain tumor and organ segmentation tasks [21]. Cross-modal attention mechanisms, wherein queries derived from one modality attend to keys and values from another modality, provide a mathematically principled approach to multimodal fusion that preserves modality-specific representational spaces while enabling information exchange at multiple levels of abstraction [22]. These architectural innovations motivate the application of multimodal transformers to ophthalmic imaging, where the integration of fundus photography, optical coherence tomography, and clinical variables through cross-attention mechanisms may uncover synergistic predictive features for AMD progression [23].
The proposed framework accepts three parallel input streams consisting of a fundus photograph, an optical coherence tomography volume, and a vector of structured clinical variables, routing each through a dedicated modality-specific encoder before projecting the resulting embeddings into a shared token space for cross-modal processing [24]. The fundus encoder employs a vision transformer that partitions the image into fixed-size patches, embeds each patch into a token representation, and applies self-attention layers to capture spatial relationships between drusen fields, pigmentary abnormalities, and other retinal landmarks relevant to AMD progression [25]. The optical coherence tomography encoder processes the three-dimensional volume by applying either a volumetric vision transformer or per-B-scan encoding with subsequent spatial aggregation, extracting features related to drusen morphology, hyperreflective foci distribution, and retinal pigment epithelium integrity [26]. The clinical variable encoder transforms categorical and continuous risk factors through an embedding and normalization pipeline that produces a fixed-dimensional representation compatible with the image-derived token sequences. The multimodal tokens are then passed through a series of cross-attention transformer layers that enable each modality to attend to information from the complementary modalities, generating a fused representation that is aggregated via a learnable classification token and projected to a scalar progression probability [27].
Figure 1 presents the proposed multimodal transformer architecture for integrating fundus photography, optical coherence tomography, and structured clinical variables into calibrated progression-risk estimates for neovascular AMD.
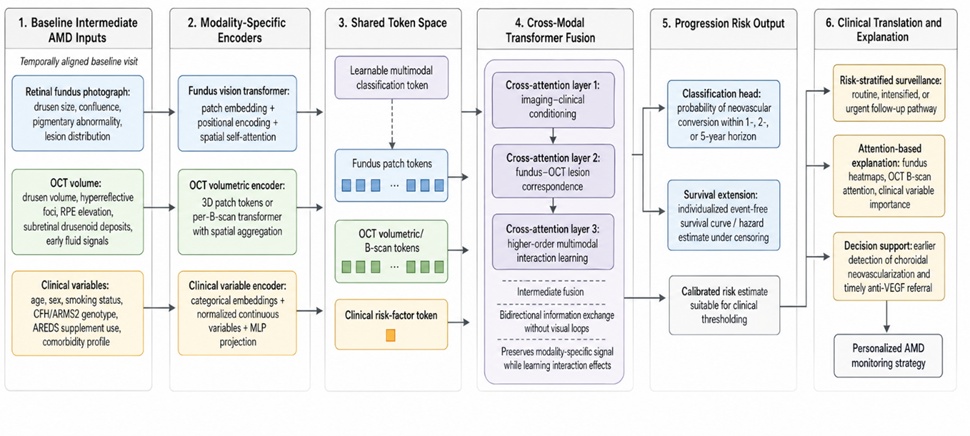
Figure 1. Multimodal Transformer Framework for Predicting Progression from Intermediate to Neovascular Age-Related Macular Degeneration.
The framework operates under several foundational assumptions regarding data availability and task formulation that constrain its applicability and must be explicitly acknowledged in any implementation context [28]. The first assumption requires that every patient in the training and inference cohorts possesses paired fundus and optical coherence tomography images acquired at the same baseline visit, ensuring that the multimodal fusion occurs over temporally aligned measurements that reflect a consistent disease state. The second assumption mandates the availability of longitudinal follow-up data documenting the time to neovascular conversion or the duration of stable intermediate AMD without conversion, enabling the training of supervised progression prediction models with clearly defined outcome labels. The third assumption presupposes the availability of structured clinical variables including age, sex, smoking status, genetic testing results for CFH and ARMS2 polymorphisms, and AREDS supplement use, recognizing that missing data in any of these domains may necessitate imputation strategies or modality-dropping inference procedures [29].
The architectural design of the proposed framework is guided by three principles that reflect both the clinical requirements of AMD progression prediction and the technical desiderata of multimodal learning systems [1]. The principle of multimodal integration holds that each input modality contributes non-redundant prognostic information, and that the architecture should preserve modality-specific representational capacity while enabling cross-modal information flow rather than employing early concatenation that may obscure modality-specific signal. The principle of cross-modal attention asserts that allowing image-derived features to attend to clinical risk variables and vice versa enables the discovery of interaction effects, such as genetic risk factors that manifest more strongly in eyes with specific imaging phenotypes, that would be inaccessible to models processing modalities independently. The principle of temporal awareness recognizes that progression prediction is inherently a longitudinal task, and that the framework should accommodate survival analysis formulations that account for censored observations and variable follow-up durations rather than reducing the problem to a static binary classification [2].
Table 1 clarifies how each modality contributes distinct prognostic information and why intermediate cross-modal fusion is conceptually preferable to single-modality or late-fusion prediction strategies.
Table 1. Modality-Specific Prognostic Contributions and Fusion Logic in Multimodal AMD Progression Prediction
Input domain | Primary AMD information captured | Prognostic signal unavailable from other modalities | Encoder function in the proposed framework | Cross-modal interaction enabled | Clinical interpretation value |
Fundus photography | En face drusen burden, drusen confluence, pigmentary abnormality, lesion distribution across the macula | Spatial distribution of visible AMD lesions across the posterior pole | Converts retinal image patches into spatial tokens using vision transformer patch embeddings and self-attention | Fundus tokens contextualize OCT abnormalities by locating whether cross-sectional lesions correspond to extensive macular disease | Helps clinicians visually relate risk to familiar fundus-based AMD grading features |
Optical coherence tomography | Drusen volume, RPE elevation, hyperreflective foci, subretinal drusenoid deposits, early exudative changes | Cross-sectional retinal morphology and subtle pre-neovascular structural disruption | Produces volumetric or B-scan-level tokens sensitive to retinal layer morphology and lesion depth | OCT tokens refine fundus interpretation by identifying which visible lesions have high-risk internal structure | Supports anatomical explanation of risk through B-scan attention maps |
Clinical variables | Age, sex, smoking history, CFH/ARMS2 genotype, AREDS use, systemic risk profile | Patient-level susceptibility and behavioral/genetic risk not directly visible in images | Converts heterogeneous categorical and continuous variables into a clinical risk-factor token | Clinical token conditions imaging interpretation on inherited and modifiable susceptibility | Enables individualized risk decomposition and patient-facing risk communication |
Multimodal classification token | Aggregated patient-level representation | Joint imaging–clinical interaction pattern | Accumulates information from all modality tokens through cross-attention | Learns higher-order signatures that may not be detectable in single-modality models | Produces a unified risk estimate suitable for threshold-based surveillance planning |
Survival-risk head | Time-to-event progression trajectory | Timing of neovascular conversion under censoring | Converts fused representation into hazard or survival estimates | Links multimodal risk signatures to individualized progression timelines | Supports personalized follow-up interval selection rather than static risk labeling |
Fundus photographs acquired under standardized imaging protocols are preprocessed to a uniform resolution, with input dimensions of 224 by 224 or 512 by 512 pixels providing sufficient spatial detail to resolve drusen boundaries while maintaining computational tractability for transformer architectures [3]. The vision transformer encoder partitions each fundus image into a regular grid of non-overlapping patches measuring 16 by 16 pixels, linearly projecting each patch into a high-dimensional embedding space and prepending a learnable classification token that aggregates global image information through the subsequent self-attention layers [4]. Positional encodings are added to the patch embeddings to preserve spatial information, enabling the self-attention mechanism to learn relationships between drusen located in the foveal center, parafoveal region, and peripapillary area, which carry differential prognostic significance for progression risk [5]. The output of the fundus encoder consists of a sequence of patch-level token representations alongside the refined classification token, both of which are forwarded to the cross-modal transformer for integration with features derived from optical coherence tomography and clinical variables [6].
Optical coherence tomography volumes present a distinct encoding challenge due to their three-dimensional nature, comprising sequential B-scans that capture cross-sectional retinal anatomy at closely spaced intervals across the macular cube [7]. Two encoding strategies are compatible with the framework: a volumetric vision transformer that partitions the entire three-dimensional volume into cubic patches and applies self-attention jointly across all spatial dimensions, or a hybrid approach wherein a two-dimensional vision transformer processes each B-scan independently and a subsequent spatial attention or recurrent aggregation module synthesizes the per-slice features into a volumetric representation [8]. The OCT encoder must be sensitive to biomarkers that precede neovascular conversion, including drusen volume and reflectivity, hyperreflective foci located above the retinal pigment epithelium, subretinal drusenoid deposits, and incipient retinal pigment epithelium detachments that may represent early exudative activity [9]. The encoded OCT token sequence captures these morphological features at multiple spatial scales and is passed to the cross-modal transformer where OCT-derived features can attend to fundus-derived features describing the en face distribution of corresponding lesions [10].
Structured clinical variables are encoded through a dedicated processing pipeline that transforms heterogeneous data types into a unified vector representation suitable for integration with image-derived token sequences [11]. Categorical variables including sex, smoking status categorized as never, former, or current, and CFH and ARMS2 genotype expressed as risk allele counts undergo embedding layer transformation that learns dense vector representations capturing the prognostic implications of each category in the context of the prediction task [12]. Continuous variables including age in years and body mass index are normalized to zero mean and unit variance using statistics derived from the training cohort, ensuring numerical stability during gradient-based optimization. The embedded and normalized features are concatenated and projected through a multilayer perceptron with one or two hidden layers that produce a fixed-dimensional clinical token representation aligned with the dimensionality of the image-derived tokens [13]. This clinical token serves as an additional input to the cross-modal transformer, enabling the model to condition its imaging feature interpretation on patient-specific risk factor profiles and to learn interactions between genetic susceptibility and structural disease manifestations [14].
The cross-modal transformer constitutes the architectural core of the proposed framework, comprising a stack of transformer layers in which self-attention is augmented or replaced by cross-attention operations that enable information exchange between the fundus, optical coherence tomography, and clinical variable token sequences [15]. In each cross-attention layer, queries derived from one modality attend to keys and values derived from another modality, allowing fundus patch tokens to retrieve information about corresponding cross-sectional structures in the OCT volume and enabling clinical tokens to modulate their representation based on imaging features present in both modalities [16]. The bidirectional nature of this cross-attention mechanism ensures that each modality's representation is refined through exposure to complementary information, such that a drusenoid pigment epithelial detachment visible on OCT can inform the interpretation of the corresponding fundus region, while the en face extent of drusen seen on fundus photography can contextualize focal OCT abnormalities [17]. Multiple cross-attention layers stacked in sequence allow the model to learn increasingly abstract multimodal representations that capture higher-order interactions between imaging phenotypes and clinical risk profiles [18].
The fusion strategy adopted in this framework follows an intermediate fusion paradigm, wherein cross-attention between modalities occurs at multiple transformer layers rather than at a single concatenation point, enabling the model to learn modality interactions at different levels of representational abstraction [19]. A learnable multimodal classification token is prepended to the concatenated token sequences entering the cross-modal transformer, serving as an aggregation point that accumulates information from all three modalities through the successive cross-attention layers [20]. This classification token ultimately encodes a joint multimodal representation that synthesizes fundus-derived spatial features, OCT-derived cross-sectional biomarkers, and clinical risk factor information into a unified embedding optimized for the downstream progression prediction task [21]. The intermediate fusion approach contrasts with early fusion strategies that concatenate raw or lightly processed inputs before encoding and late fusion strategies that combine modality-specific predictions through averaging or learned weighting, offering a favorable balance between modality-specific feature extraction and cross-modal information integration [22].
Following the cross-modal transformer layers, the refined token sequences from each modality and the multimodal classification token must be aggregated into a fixed-dimensional representation suitable for progression probability estimation [23]. The primary aggregation mechanism employs the multimodal classification token, which has attended to all three modalities throughout the cross-modal processing and therefore encodes a comprehensive summary of the patient's multimodal profile [24]. Alternative aggregation strategies that may complement the classification token include mean pooling over all token representations, attention-weighted pooling that emphasizes tokens most relevant to the prediction task, or modality-specific pooling followed by concatenation and projection [25]. The aggregated multimodal representation is passed through a prediction head consisting of one or more fully connected layers with appropriate nonlinearities, ultimately producing the scalar logit or hazard parameter that quantifies the risk of progression from intermediate to neovascular AMD within the specified prediction horizon [26].
The primary prediction task formulated within this framework is the binary classification of whether an eye with intermediate age-related macular degeneration will progress to neovascular disease within a prespecified time horizon, with clinically relevant windows of one, two, and five years corresponding to short-term, medium-term, and long-term risk stratification strategies respectively [27]. The aggregated multimodal representation derived from the cross-modal transformer is projected through a classification head that outputs a probability estimate calibrated to reflect the likelihood of progression within the target horizon, enabling clinicians to assign patients to risk categories that inform surveillance frequency and treatment timing decisions [28]. The binary classification formulation aligns with established outcome definitions in landmark AMD clinical trials and natural history studies, where progression is defined by the development of choroidal neovascularization confirmed through fluorescein angiography or optical coherence tomography angiography and adjudicated by reading center evaluation [29].
The binary classification formulation, while clinically interpretable, discards temporal information about the precise timing of progression events and does not naturally accommodate censored observations arising from patients lost to follow-up or who have not yet experienced the event at the conclusion of the observation period [1]. A survival analysis extension of the framework addresses these limitations by reformulating the prediction task as time-to-event modeling, wherein the multimodal transformer output is passed through a hazard prediction head that estimates either the parameters of a discrete-time survival distribution or the log-hazard ratio within a Cox proportional hazards framework [2]. The survival loss function appropriately handles right-censored observations by contributing only the survival probability to the likelihood for patients who remain event-free at their last follow-up visit, while incorporating both the hazard at the event time and the cumulative survival probability for patients who experience progression [3]. This extension enables the framework to generate individualized survival curves that depict the probability of remaining free of neovascular conversion over time, providing a more granular risk assessment that can guide personalized monitoring intervals [4].
Attention weights from the cross-modal transformer layers can be projected as heatmap overlays onto fundus photographs, highlighting drusen hotspots and pigmentary abnormalities that drive progression risk, thereby offering clinicians a visual explanation aligned with established AMD biomarkers [5,6]. For OCT volumes, attention maps across B-scans indicate which cross-sectional locations contain predictive features such as hyperreflective foci or subtle retinal pigment epithelium elevations [7]. Alignment between attention patterns and known precursors of choroidal neovascularization validates that the model learns clinically meaningful features, while discrepancies may reveal novel imaging signatures warranting investigation [8].
Attention weights assigned to clinical variable tokens provide a quantitative measure of which risk factors exert the greatest influence on an individual patient’s prediction [9]. Examining attention scores linking the multimodal classification token to embedded clinical variables reveals whether genetic predisposition, smoking history, or advanced age dominates the risk profile and whether these factors interact synergistically with imaging findings [10]. This attention-based variable importance enables personalized risk decomposition, wherein total predicted risk can be attributed to contributing factors and communicated to patients during shared decision-making about surveillance intensity and lifestyle modification [11]. Such transparency is valuable given that patients may benefit from understanding how modifiable factors could potentially alter their trajectory, though interventional validation remains necessary [12].
Evaluation requires comprehensive metrics assessing discrimination, calibration, and clinical utility across multiple prediction horizons and under censored outcomes when the survival extension is employed [13]. Discrimination metrics for binary classification include AUROC, summarizing sensitivity-specificity trade-offs, and AUPRC, which is particularly informative when the progression event rate is low [14]. For the survival extension, time-dependent AUC metrics and the concordance index provide appropriate assessments of discriminative performance over follow-up duration [15]. Sensitivity and specificity at clinically relevant thresholds, such as 80, 90, and 95 percent sensitivity, quantify practical utility for screening applications [16].
Table 2 provides an evaluation and translation matrix that links statistical validation, architectural ablation, interpretability, and clinical deployment requirements for the proposed AMD progression framework.
Table 2. Evaluation and Translation Matrix for Multimodal Transformer-Based AMD Progression Prediction
Evaluation dimension | Core question addressed | Recommended analysis | Required comparator or reference point | Clinical decision relevance |
Discrimination | Can the model separate eyes that progress from those that remain stable? | AUROC, AUPRC, time-dependent AUC, concordance index for survival extension | Fundus-only, OCT-only, clinical-only, fundus+OCT, and full multimodal model | Determines whether the model can support risk stratification beyond standard surveillance |
Calibration | Do predicted probabilities match observed conversion rates? | Calibration curves, Brier score, expected calibration error, horizon-specific calibration | Uncalibrated transformer output and conventional risk-score baselines | Prevents over-monitoring from inflated risk estimates and missed progression from underestimated risk |
Incremental modality value | Does each data stream add non-redundant predictive information? | Modality-ablation experiments and stepwise performance comparison | Single-modality and two-modality variants | Justifies the clinical and logistical cost of acquiring paired multimodal data |
Fusion mechanism value | Does cross-attention improve over simpler integration? | Compare intermediate cross-modal attention with early concatenation and late prediction averaging | Identical encoders with different fusion strategies | Establishes whether architectural complexity produces meaningful clinical gain |
Robustness to missingness | Can inference remain usable when one modality is unavailable? | Modality-dropout testing, missing-data simulation, subgroup performance analysis | Complete-case model performance | Determines feasibility in real-world ophthalmology clinics with incomplete imaging or genetic data |
Interpretability validity | Do model explanations align with known AMD biomarkers? | Fundus attention maps, OCT B-scan attention, clinical-token importance, expert review | Reading-center lesion annotations or clinician-identified biomarkers | Supports clinician trust and identifies whether predictions depend on plausible disease mechanisms |
Survival utility | Can the model guide timing of follow-up rather than only binary risk? | Individualized survival curves, hazard calibration, censoring-aware loss evaluation | Binary classification model at fixed horizons | Enables personalized monitoring intervals for intermediate AMD patients |
Equity and generalizability | Does performance remain stable across populations and acquisition settings? | External validation, subgroup analysis by age, sex, ethnicity, device type, and clinic site | Development cohort performance | Reduces risk of biased deployment and supports broader clinical translation |
Ablation experiments systematically removing modalities or components are essential for quantifying each data source's marginal contribution to predictive performance [17]. The ablation design should compare fundus-only, OCT-only, clinical-only, combined fundus-plus-OCT without clinical variables, and the full three-modality framework [18]. Additional ablations targeting architectural choices, including removal of cross-modal attention layers in favor of late concatenation, substitution of the vision transformer with convolutional backbones, and comparison of volumetric versus per-B-scan OCT encoding, provide insight into specific design decisions [19]. Incremental performance gains when adding successive modalities quantify the value of multimodal integration and justify the increased complexity of the full framework [20].
Calibration assessment evaluates whether predicted progression probabilities accurately reflect observed progression rates, a property critical for clinical decision-making where risk thresholds guide surveillance intensity [21]. Calibration curves plotting predicted probabilities against observed event frequencies provide visual assessment of agreement, with perfect calibration corresponding to the identity line [22]. Summary metrics including the Brier score and expected calibration error complement visual assessment with numerical measures facilitating comparison between model variants [23]. Calibration is particularly important because overconfident risk estimates could cause unnecessary anxiety and excessive monitoring, while underconfident estimates could result in missed opportunities for early detection [24].
The framework requires high-quality, paired fundus and OCT images acquired under standardized protocols, constraining generalizability to settings where imaging equipment and operator expertise vary from training data [25,26]. Outcome annotation necessitates long follow-up durations of two to five years with consistent imaging intervals, creating substantial barriers to assembling large training cohorts with complete outcome ascertainment [27]. Modeling genetic risk through individual variants such as CFH and ARMS2, while well-established, may fail to capture AMD's polygenic architecture, and small sample sizes may preclude stable embeddings for rare variants [28].
The framework specifically addresses neovascular AMD progression and does not encompass geographic atrophy development, a distinct late AMD phenotype with different risk factors and clinical implications [29]. Reliance on clinic-based data collection may introduce selection biases if the training population differs systematically from the broader intermediate AMD population in healthcare access, disease severity, or comorbidity profiles, necessitating validation across diverse racial, ethnic, and socioeconomic groups. Furthermore, the framework predicts anatomical progression defined by imaging-detected choroidal neovascularization, which may not perfectly correlate with symptom onset or optimal treatment timing, leaving a gap between predicted risk and clinical action [1,2].
The conceptual framework presented in this manuscript articulates a principled approach to multimodal AMD progression prediction that integrates fundus photography, optical coherence tomography, and structured clinical variables within a transformer architecture capable of learning cross-modal dependencies through attention mechanisms. By encoding each modality through dedicated encoders optimized for its specific data characteristics and subsequently enabling information exchange through cross-attention layers, the framework captures complementary prognostic signals that may remain inaccessible to models limited to single modalities or simpler fusion strategies. The architecture is designed with clinical translation in mind, incorporating interpretability mechanisms based on attention visualization and clinical variable importance attribution that can support individualized risk communication and shared decision-making between clinicians and patients.
The key advantages of the proposed framework lie in its capacity to learn from complementary modalities that capture distinct aspects of AMD pathology, its use of cross-modal attention to model interactions between imaging phenotypes and clinical risk factors, and its provision of interpretable predictions that can be decomposed into contributing features and visualized through attention heatmaps. The survival analysis extension further enhances clinical utility by generating individualized risk trajectories that account for variable follow-up durations and censored observations, moving beyond static binary predictions toward dynamic risk assessment that can inform personalized monitoring schedules. The framework's modular design allows individual components to be refined as advances in computer vision and multimodal learning continue to emerge.
Several limitations temper the immediate clinical applicability of the framework, including the requirement for high-quality paired imaging data, the substantial follow-up duration needed for outcome ascertainment, and the need for validation across diverse populations and healthcare settings. The framework does not address geographic atrophy progression, and the translation of predicted conversion risk into specific clinical actions requires additional evidence linking risk-stratified surveillance to improved visual outcomes.
Implementation of this framework on large-scale public datasets, including the Age-Related Eye Disease Study cohorts, the UK Biobank, and emerging multimodal ophthalmic datasets, will be essential to establish feasibility and clinical value. Prospective validation studies evaluating the impact of risk-stratified monitoring on visual outcomes and healthcare resource utilization will ultimately determine whether such frameworks can fulfill their promise of enabling personalized, proactive care for patients at risk of neovascular age-related macular degeneration.
None
None
None
None
Open Access The author(s) retain copyright. This article is licensed under the Creative Commons Attribution-NonCommercial-ShareAlike 4.0 International License. It may be shared and adapted for non-commercial purposes with appropriate attribution, an indication of changes, and distribution of adaptations under the same license. Third-party material may be subject to separate terms identified in its credit line. View the license at https://creativecommons.org/licenses/by-nc-sa/4.0/.
 Clinical Intelligence Research Press